PCA with Scikit learn on the Iris data set
Tue, Feb 23, 2016Scikit learn has multiple data sets included with the library. One of the most well known data sets is the Iris data set introduced by Ronald Fisher.
Four features were measured from each sample: the length and the width of the sepals and petals, in centimetres. Sepals are usually green and typically function as protection for the flower in bud, and often as support for the petals when in bloom. Based on the combination of these four features the goal is to distinguish between three species of Iris (Iris setosa, Iris virginica and Iris versicolor).
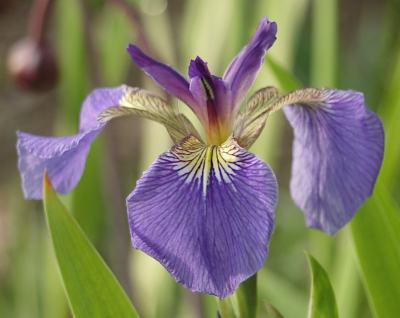
Iris setosa
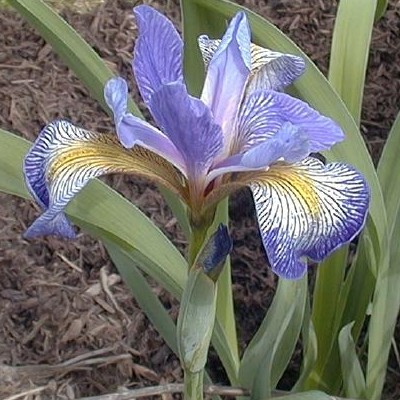
Iris virginica
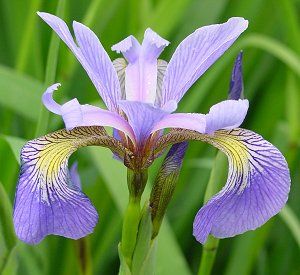
Iris versicolor
The data is shown in a Jupyter (IPython) notebook in this repository.
By converting the scikit-learn data into a pandas dataframe it can easily be plotted using the seaborn library.
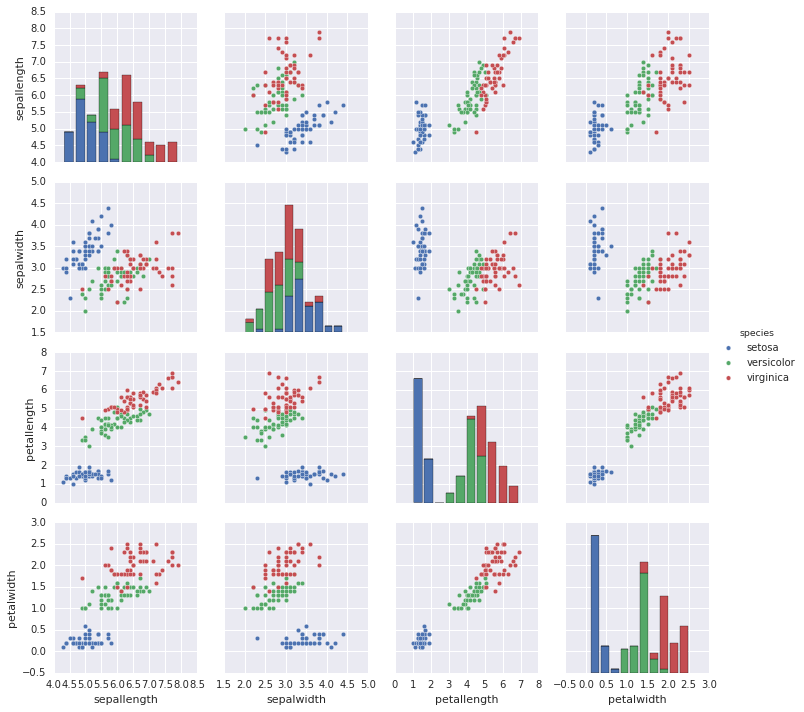
Seaborn iris plot
Using principal component analysis (PCA) the four dimensional data set can be converted into a two dimensional data set by only choosing the first two principal components.
from sklearn.decomposition import PCA
pca = PCA(n_components=2)
iris_proj = pca.fit_transform(iris['data'])
print(iris['data'].shape)
print(iris_proj.shape)
The first principal component explains 92.46% of the variance and the second explains 5.30% of the variance.
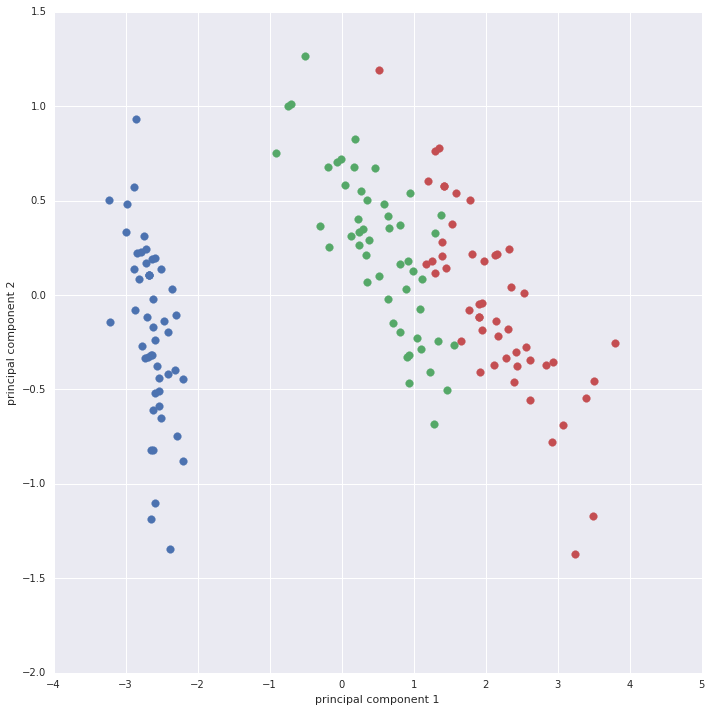
First two principal components of the Iris data