Scaling input data
Wed, Sep 21, 2016Some machine learning algorithms in the sklearn library are affected by data measured using different scales. For example if one measure is in centimeters (one hundreth of a meter) and another is in micrometers (one millionth of a meter) the results may not be optimal.
Sklearn has scaling functions in the preprocessing module
Load the Iris dataset. It has three kinds of Irises with each Iris species stored in 50 consecutive rows. Loading the second and third Iris species stored from row 50 and above create a subset of the data.
Display the two species versicolor and virginica with two axis: sepal length and sepal width. The sepal length is in centimeters and the sepal width is in micrometers.
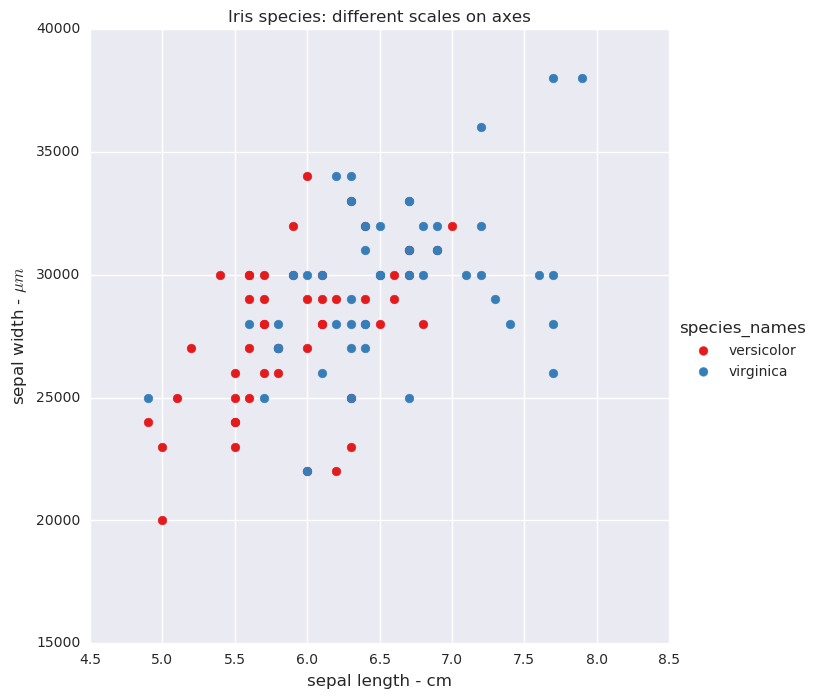
Iris species: different scales on x and y axes
Using the scale function in sklearn the measures are converted to have a mean of zero and variance of one.
| measure | sepal length | sepal width | species |
|---|---|---|---|
| count | 1.000000e+02 | 1.000000e+02 | 100.0000 |
| mean | 3.288481e-15 | 4.496403e-17 | 1.500000 |
| stdev | 1.005038e+00 | 1.005038e+00 | 0.502519 |
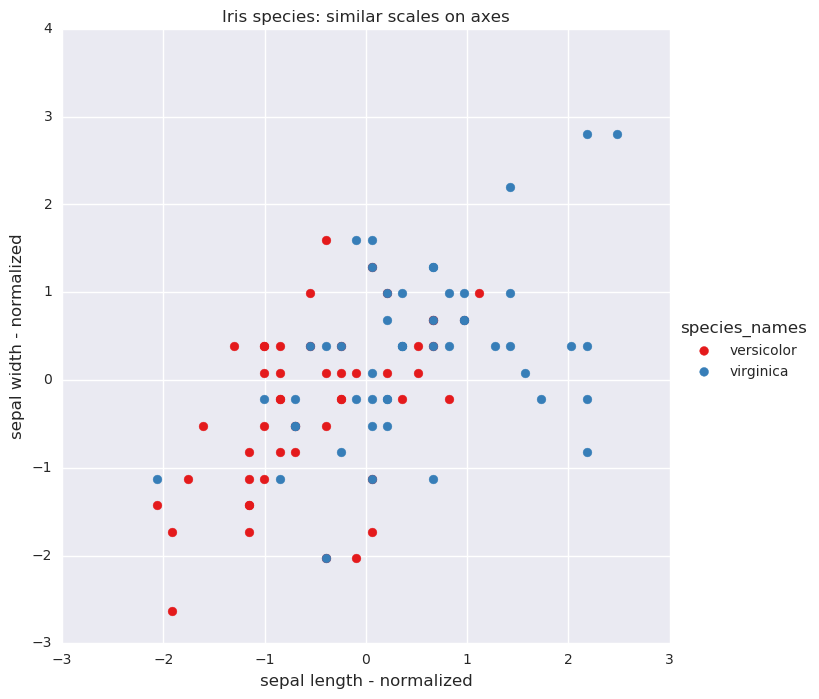
Iris species: normalized axes
Using logistic regression and a decision tree classifier with the original data and normalized data the results are in the table below.
| classifier | accuracy | precision | recall |
|---|---|---|---|
| Logistic regression: different scales | 0.56 | 0.578947 | 0.44 |
| Logistic regression: normalized data | 0.75 | 0.745098 | 0.76 |
| Decision tree: different scales | 0.88 | 0.816667 | 0.98 |
| Decision tree: normalized data | 0.88 | 0.816667 | 0.98 |
The logistic regression method improves when using normalized data however the decision tree method does equally well with the original data and the normalized data.