K nearest neighbors using Scikit-learn
Sun, Mar 27, 2016The k-nearest neighbors algorithm is one of the simplest algorithms for machine learning. It is a non-parametric method used for both classification and regression.
In a classification problem an object is classified by a majority vote of its neighbors. Typically k is a small positive integer. If k = 1, the object is assigned to be the class of the nearest neighbor. If k = 3 the object is assigned to be in the class of the nearest 2 neighbors and so on for different values of k.
In a regression problem, the property of the object is assigned a value that is the average of the values of its k nearest neighbors.
The Scikit-learn library module KNeighborsClassifier demonstrates the use of the k-nearest neighbor algorithm for classification.
This Jupyter notebook contains all the code used to plot the charts.
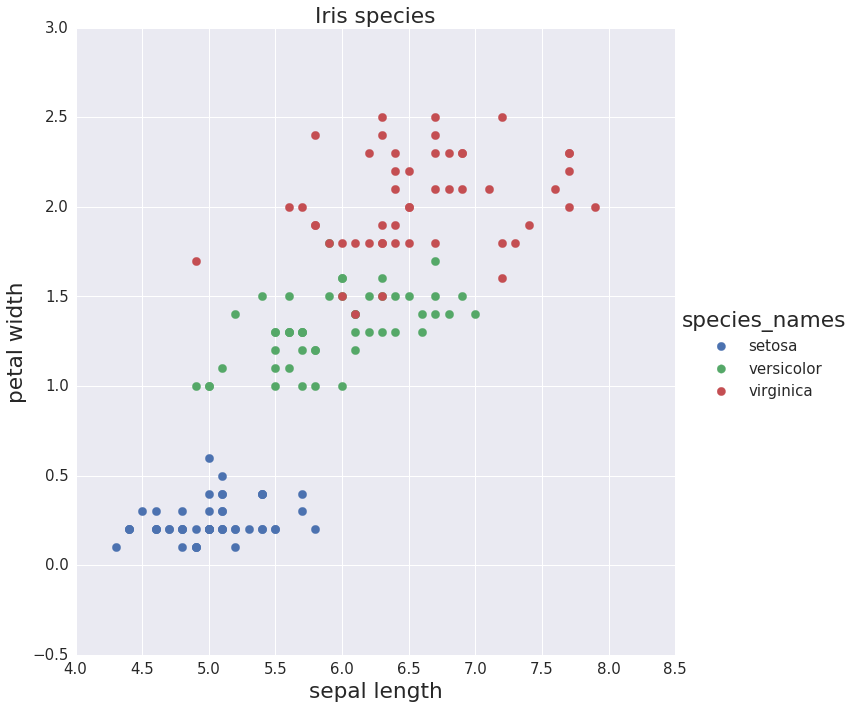
The Iris data set has four features (sepal length, sepal width, petal length, petal width) which can be used to classify Iris flowers into three species denoted as “0”, “1”, “2” (setosa, versicolor, virginica).

Scatter plot of Iris species
The K-nearest neighbors classifier is used to predict the species by using just two features: “sepal length” and “petal width”.
The graphs below show the predictions of the k-nearest neighbors algorithm using three different values for the number of nearest neighbors.

Using k-nearest neighbors to predict Iris species
When the k value is small (like the graph on the left) the decision boundary is relatively complex and even though the algorithm predicts the training data well, it is likely over-fitting the data and fair poorly on a new sample. For a very high value of k (like the graph on the right) the method the decision boundary is simpler and likely to under-fit the training data.