Decision trees on the Iris data set
Sun, Mar 13, 2016Decision trees are a non-parametric learning method used for classification and regression. Trees are often represented with a graph like model where each note is a test and each branch represents the outcome of the test.
We use the Iris data set to demonstrate the use of a decision tree classifier.
The Iris data set has four features (sepal length, sepal width, petal length, petal width) which can be used to classify Iris flowers into three species denoted as “0”, “1”, “2” (setosa, versicolor, virginica).
This Jupyter notebook contains all the code used to plot the charts.
To better display the performance of the decision trees algorithm we predict the species of Iris using just two features: petal length and petal width. The species are shown in a scatter plot in different colors.
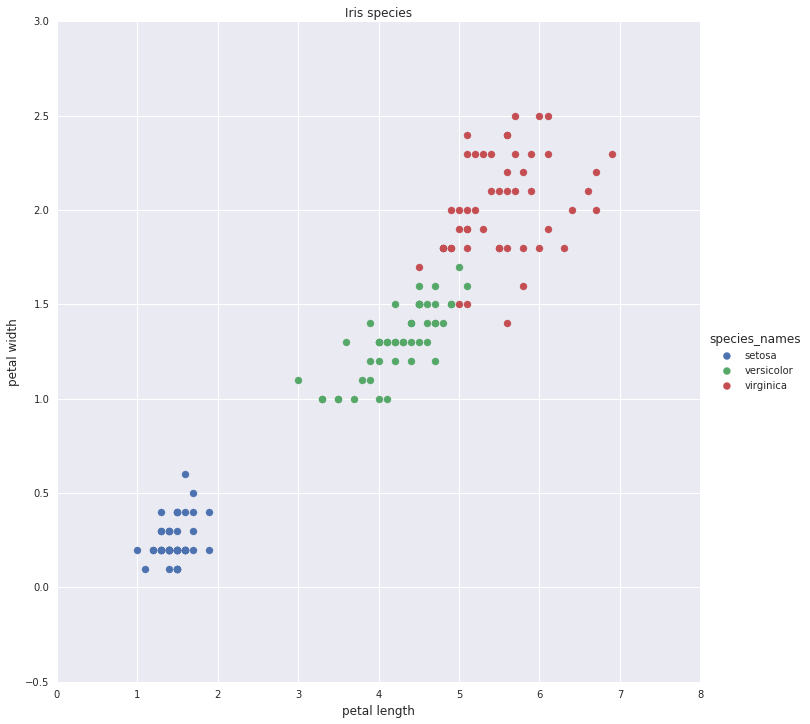
Scatter plot of Iris species
The output of the decision tree is shown using shaded regions that match the colors used to identify the flower. Using a decision tree with various depths the three species of Iris are classified, ineffectively at first with a tree of only one layer. As the number of layers increase the decision tree does a better job identifying the Iris species.
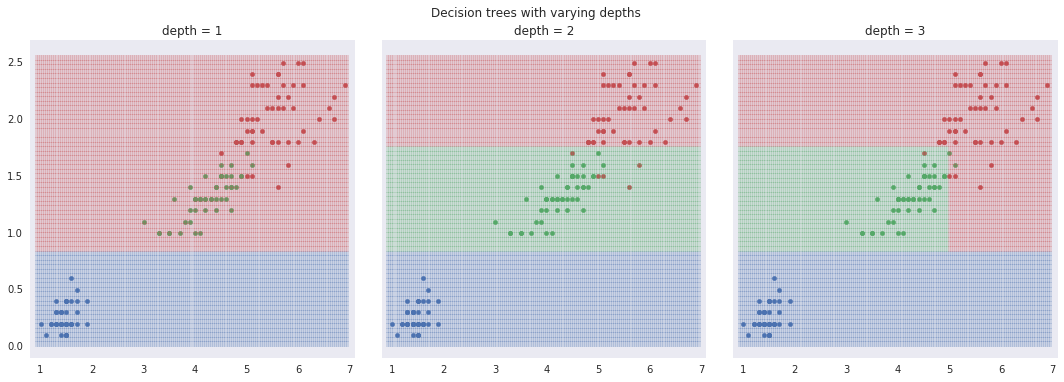
Decision trees classification boundaries
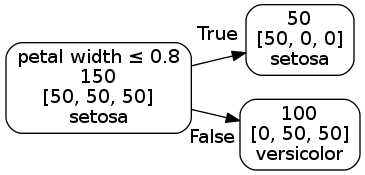
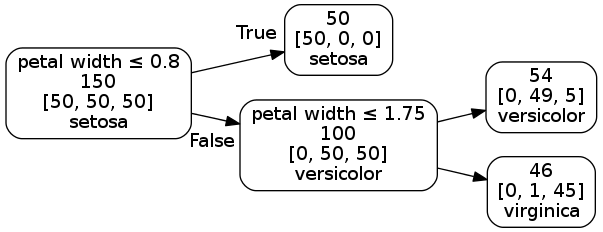
The decision tree rules can also be represented using a graph like drawing with the root node on the left and the leaf nodes on the right.
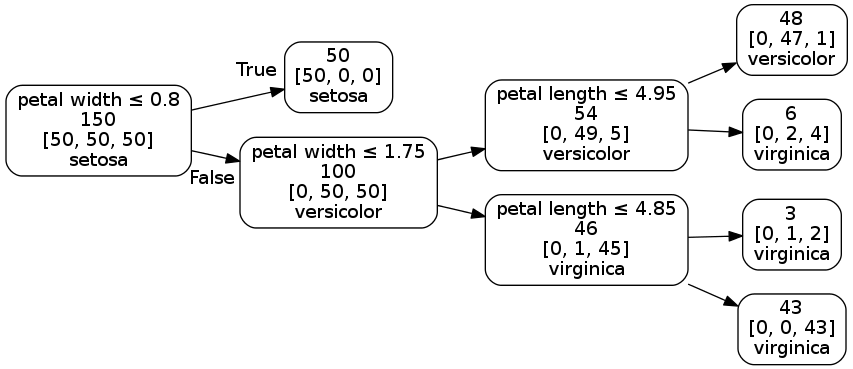
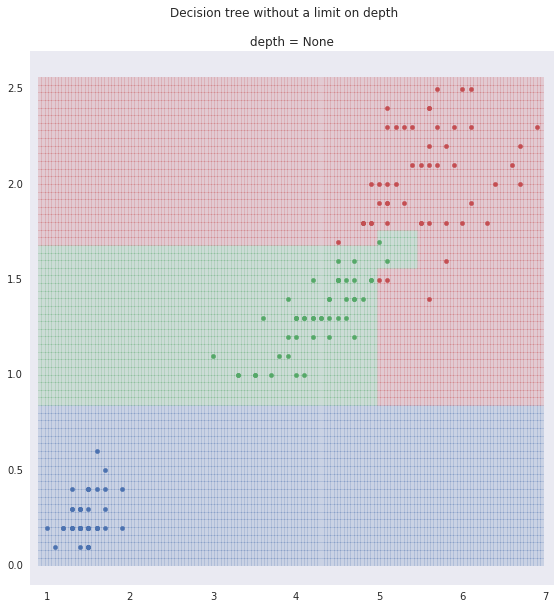
Finally we use a decision tree without limiting the depth. It classifies all the flowers correctly.